Chart-integration
Quickchart integration component. Turn CSV files to graphical chart representation
Chart-integration is an integration component built for RedHat JBoss Fuse that converts CSV files to graphical charts. It uses QuickChart API, built on Chart.js, for generating chart images.
Features
- Import a CSV file and watch it magically convert into a graphical chart in PNG format.
- Select between bar, line, radar, doughnut or pie charts.
- Configure email notifications for every time a chart is generated successfully or when an error occurs.
Assumptions
This component makes the following assumptions:
- The input files are always in CSV format.
- An input file only contains data for one chart.
- The labels of the chart will be always the first row.
- The first value in the first row is always ignored.
- The chart to be generated will always be of type bar unless otherwise specified in the filename of the CSV.
Installation
Chart-integration requires the following stack:
You can follow this guide to install JBoss Fuse on JBoss EAP.
Configuration
The folder “ChartIntegration” located in “src/dev” contains all the configuration files needed to set up the integration component:
- configuration.properties: Properties file to set configuration values.
- conf: Configuration folder, contains the OK and KO email templates.
- work: Folder containing de input, output and processed directories.
- testFiles: Folder containing the test files.
To configure Chart-integration, you must follow this steps:
- Copy the folder “ChartIntegration” located in “src/dev” into the JBoss installation root directory.
- Through JBoss CLI, add a String value into JNDI referencing the “configuration.properties” file location.
/subsystem=naming/binding=java:/chart-integration/configuration.properties:add(value="file:/path/to/ChartIntegration/configuration.properties",binding-type=simple)- If you want to set email notifications, edit the file “configuration.properties” and fill up the properties that start with “email”. Otherwise, just leave empty the property “email.smtp.server” to disable email notifications.
- You are done!
Configuration file
The properties of the configuration file are described below:
-
General:
- general.file.delimiter: Delimiter of the CSV files.
- general.directory.input: Input directory. CSV files to convert should be left here.
- general.directory.output: Output directory. Charts (in PNG format) will be left here.
- general.directory.processed: Processed directory. Once the chart is generated, the original CSV file will be left here with .BAK extension.
-
Email notifications:
- email.smtp.server: SMTP Server. Set it to “smtp.gmail.com” if you want to use gmail. Leave empty if you don’t want to use email notifications.
- email.smpt.port: SMTP Port. Set it to “25” if you want to use gmail.
- email.smtp.requiresAuthentication: Boolean that defines if the SMTP connection requires authentication.
- email.smtp.authentication.username: SMTP Authentication username. Leave empty if the SMTP doesn’t requires authentication.
- email.smtp.authentication.password: SMTP Authentication password. Can be encrypted with JBoss Password Vault. Leave empty if the SMTP doesn’t require authentication.
- email.notification.from: Email notification sender.
- email.notification.to: Email notification receivers separated by commas.
- email.notification.subject.ok: Email subject for correct executions. Leave empty if you don’t want to use notifications for correct executions.
- email.notification.body.ok: Path to the email template for correct executions. Leave empty if you don’t want to use notifications for correct executions.
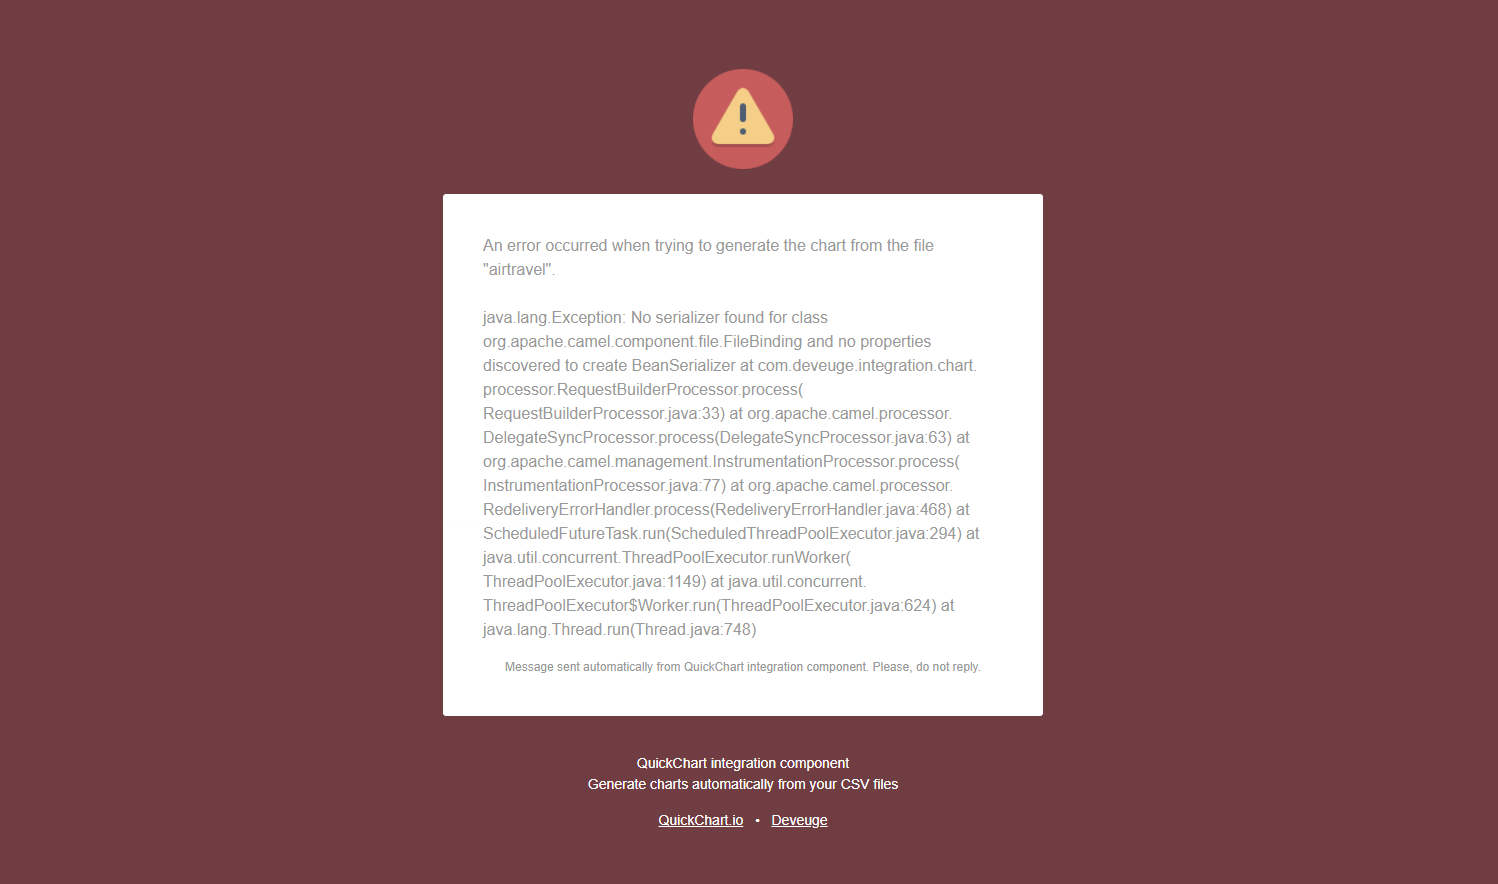
- email.notification.subject.ko: Email subject for erroneous executions. Leave empty if you don’t want to use notifications for erroneous executions.
- email.notification.body.ko: Path to the email template for erroneous executions. Leave empty if you don’t want to use notifications for erroneous executions.
Testing the component
Once the component is deployed in JBoss and the server is up and running, you can follow this steps to verify it works correctly:
- Drag a file from the “testFiles” folder to the “work/input” folder that now is located under “ChartIntegration”, in your JBoss installation directory.
- Go to the “work/output” folder and check there is now a PNG file named after your original file with a timestamp added.
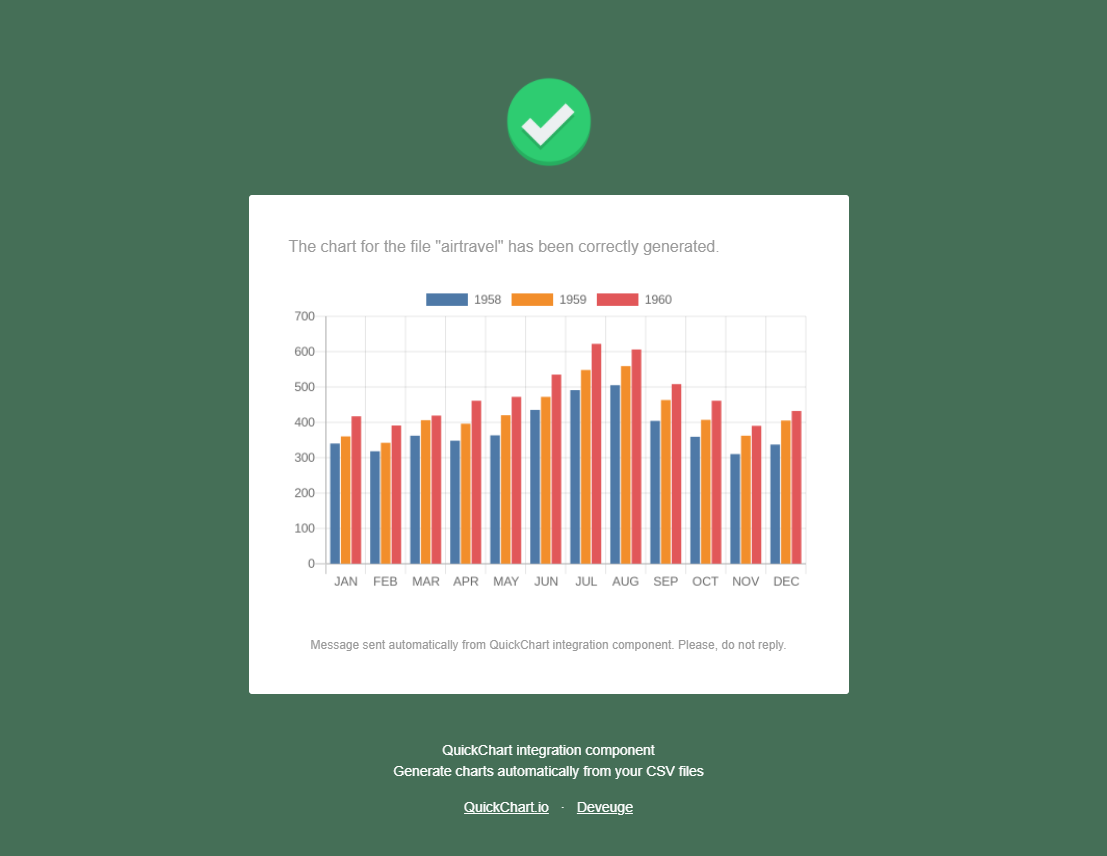
- Hooray! Your chart has been generated successfully.
- Verify that the original CSV file is now in the “work/processed” folder with .BAK extension.
Specifying the chart type to generate
By default, the component assumes the chart to generate will be a bar chart. To change this, you can add one of the following suffixes to the filename, preceding it with an ”-“:
- LINE
- BAR
- RADAR
- DOUGHNUT
- PIE
(e.g.: Rename “Sales.csv” to “Sales-LINE.csv”)
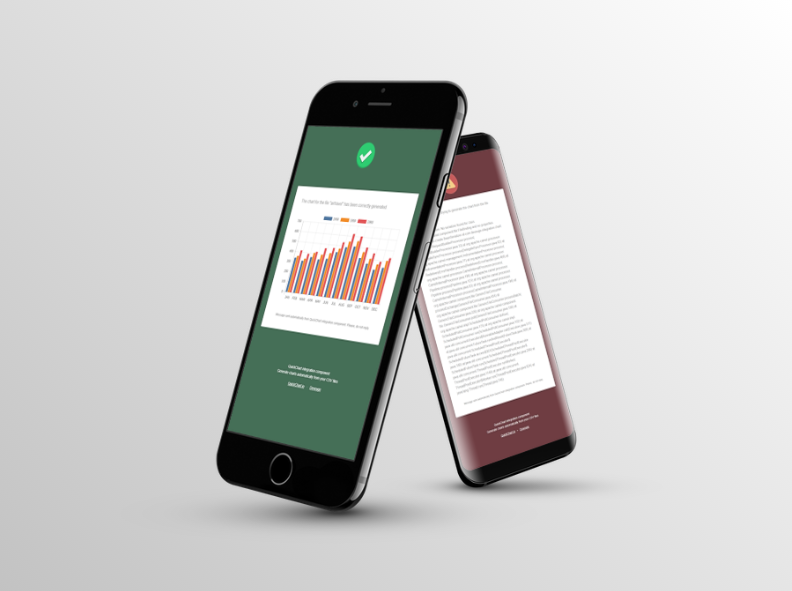
Email notifications
The email notifications can be personalized editing the templates present in the “conf” folder. For correct notifications, the generated chart will be attached to the email.
Future improvements
There is always room for improvement. Here is a list of behaviors that can be improved:
- Fix inline images in Gmail. Right now, correct email notifications in Gmail don’t show the chart image, although is attached.
- Fix input data of CSV files for pie and doughnut charts. This type of charts force the CSV file to be transposed before being processed.
- Add more chart types. Quickchart.io has a great variety of charts. Some are variations of the existing basic types (line, bar, radar, doughnut and pie). To include them, the request should contain an “options” object inside the “chart” object.
- Allow different chart formats. Quickchart.io can return the generated chart in PNG, WebP, SVG, and PDF. Right now only PNG is being used.
- Add a service to call QuickChart.io API directly.
- Add tests.